How does GDP impact housing? We make it easy to understand how the world works. And, we summarize what is going on in Western Washington today.
Welcome back to our Second Quarter 2018 Economic Update.
Last time we discussed briefly all the interlocking pieces involved in our world and how those impact not only our homes, but businesses, jobs, spending, and our daily lives. This quarter, we will tackle the great and ever elusive GDP.
As you have probably seen in the headlines, the GDP increased by 4.1% for the 2nd Quarter 2018. This is a great number and sure beats last quarter at 2.2%, but not everyone is cheering.
Wait. Back Up. What is GDP again?
GDP stands for Gross Domestic Product. Think of GDP as the value of everything we make in the United States. Things like airplanes, haircuts, soybeans, trucks, etc.
Why should we care about GDP?
Because it is a gauge of how “healthy” the economy is doing and where people are spending money in the US. There are other indicators, but GDP is a big one.
By breaking down GDP, we can see the different segments of the economy, and then make predictions for what the future looks like. After all, what would the media do without drama and predictions!?!
GDP = Consumer Spending + Investments + Government Spending + Exports
Give me the rundown.
Consumer Spending. Stuff people buy and take home.
Investments. Not real estate. In this case, we mean the stuff companies buy to expand or grow. For example, that new 3D printer for the dentist to make more dentures.
Government Spending. Simply what the federal, state, and local governments spend. It could be anything from the new highway to military defense equipment even down to the expanded office building.
Exports. These are simply items that are made in the US that are purchased by other countries. The airplane that goes to China, for example.
 GDP is tricky to measure for two reasons.
First, it is a really big number. Have you counted to roughly 20 trillion lately? Yeah, we didn’t think so. We still make A LOT of products in the US.
Second, the hardest part about GDP is that we don’t know how much something is worth until people buy it. For example, that new truck that was just manufactured in Michigan doesn’t have a value to count until we know how much someone will pay for it.
Now that you understand GDP, let’s talk about why 4.1% is being looked at with skepticism.
Our consumer spending is going well. People seem eager to buy stuff. After all, we have become a society built around imports and Amazon. We are not judging and saying it is good or bad. It just is.
The Investment section was lower than what analysts were hoping for. This indicates the same thing we see at the street level. Businesses are thrilled to be in business and selling goods and services, but they are not so optimistic about the future they want to invest more into their companies. And, that can be troubling.
Exports skyrocketed. Which is great… except there is also belief that with the announcement of tariffs last quarter, it shifted a lot of purchases forward that may not have otherwise been there. If you are a company outside of the US that buys soybeans, then you probably just bought as many soybeans as you could afford knowing that the price was about to increase 25% the following month. Of course, with this large purchase you now have extra soybeans on your shelves and probably don’t need as many next quarter. Or worse, maybe you just buy them from Brazil instead, since they are now cheaper there than from the US.
Is 4.1% GDP growth great? Yes. It shows a very healthy economy. But, there are some indicators to keep an eye on. For now, time will tell how things proceed.
With this big picture in mind about the nation, let’s talk about what is going on locally.
Washington State: JOBS
The Washington State economy added 83,900 new jobs over the past 12 months, representing an annual growth rate of 2.5%. This is a slowdown from the last quarter, but employment growth remains well above the national rate of 1.6%. Employment gains continue to be robust in the private sector, which was up by 2.8%. The public sector (government) grew by a more modest 1.1%.
The strongest growth sectors were Retail Trade and Construction, which both rose by 4.8%. Significant growth was also seen in the Education & Health Services and Information sectors, which rose by 3.9% and 3.4%, respectively.
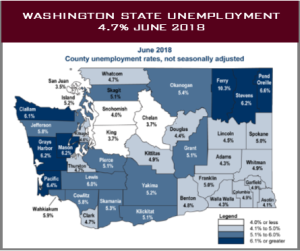 Washington State: 4.7% UNEMPLOYMENT
The State’s unemployment rate has remained steady since September 2017 at 4.7%. However, we have seen some fluctuations locally as new investment picks up.
Snohomish County unemployment increased to 4.0% from 3.8% last quarter, and King County increased to 3.7% unemployment, up from 3.4% last quarter.
Where did we gain jobs overall in Washington? Primarily the south sound. Pierce County saw unemployment decrease to 5.1% from 5.8%, Thurston County decreased to 4.7% from 5.3%, Lewis County decreased to 6.0% from 7.3%, and Mason County decreased to 6.2% from 7.1%. Washington State will continue adding jobs for the balance of the year and we anticipate total job growth for 2018 will be around 80,000, representing a total employment growth rate of 2.4% overall.
Remember, the unemployment rate only counts people who are looking for jobs in the workforce, not people who can’t work or who are sitting on the sidelines… and we have more people sitting on the sidelines today than in previous years. TBD on how that plays out in the months and years ahead.
We expect the Washington State economy to continue adding jobs in 2018, but not at the same rate as last year. Why? Remember that GDP number? It showed us that individuals were spending money, but businesses may be less optimistic on future expansion and investment. That said, we will still outperform the nation when it comes to job creation, as we have a lot of stable and “needs-based” industries here, such as Health Care, Aerospace, Education, and Transportation.
Who is making moves locally?
The big players, with a mix of both old and new tech companies. Microsoft has been busy on the Eastside, purchasing nine buildings from Blackstone near their main campus and getting ready for their major renovation plus plans to add 18 new buildings to their existing campus. The Seattle market has been busy as well, with four build-to-suit buildings under construction for Facebook, Google, and Amazon, as well as six buildings under construction built speculatively.
- Build-to-suit means the builder already knows who the buyer or tenant is and will build a custom building to fit their needs.
- Speculative development means the builder is moving forward with the project anyway and is confident they will find a buyer later.
A newer player to our region, WeWork, has been one of our most active tenants with several new leases in both downtown Seattle and Bellevue as they expand their co-working space model globally.
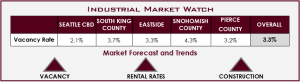
The industrial market has been expanding as well. Puget Sound saw an increase in both construction and leasing. There are currently 38 buildings that total over 7 million square feet of space under development, compared with 24 buildings at 6.1 million square feet last quarter. Assuming our local economy continues to expand, we are ready in Snohomish, Pierce, and Thurston Counties.
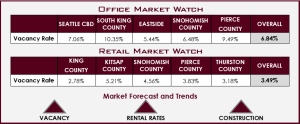
The retail market is still strong, but activity for development is slower. Our retail vacancy rate saw a small tick up to 3.49% from 3.42% (it’s only 7 basis points and it is still below 4%, so no need to panic). Our new development for retail locations is moderate, with a focus on smaller developments, single tenant buildings, and mixed-use locations like we see all over Seattle and the Eastside. The ongoing areas of concern for the retail market are still the pressure from e-commerce, increasing labor costs, and interest rates on the rise.
THE MULTI-FAMILY MARKET
If you are an owner of a multi-family property in Puget Sound, you should be pretty happy today. Since 2009, we have witnessed an ever-increasing trend in average rent per unit, combined with a decline in vacancy rates. There were 3,037 units brought to the market during the 2nd Quarter, with 27,729 units under construction. The average sales price has taken a dip overall to $175,154/unit, down from $197,603/unit last quarter. In addition, our cap rates are starting to de-compress and were 4.84%, up from 4.66% the previous quarter. Of course, as cap rates rise, values fall. We believe this is due to a couple factors that have all hit the market at the same time.
Some observations we see impacting the multi-family sector are:
- Additional increase in inventory (both for sale and for rent), that was not present last year.
- A slight increase in interest rates, which directly impacts an investor’s bottom line.
- Increased construction, maintenance, and operating costs combined with a shortage of workers.
We feel that we are near, or possibly at, the turning point for multi-family housing in certain areas. If you had any intention of selling at the top of the market, it might not be out of line to say that the time is now. Call us to explore your options.
LET’S TALK ABOUT HOUSING.
 Overall in our Puget Sound market, home sales are strong. It is not the same frenzy that we saw a year ago (thank goodness!), but things are still moving quickly when it is priced appropriately.
It is interesting talking with agents and clients on the street level. While we know that home prices overall are still trending up due to limited supply and demand. But, we are seeing many sellers get too aggressive on their pricing, which then leads to a price reduction.
Just remember, if the media starts talking about increases in price reductions and fewer offers on properties, it may be simply because sellers are currently overpricing many of their homes, not because the demand has slowed or that values are dropping.
There is a difference between seasonal changes (which are normal), corrections in the market (which are also normal), and recessions (not happening today!). Currently, our prices are leveling off as our inventory builds up… just like it does every year at this time.
If you are confused by all the media hype, then give us a call and we can set you straight here too.
HOME SALES ACTIVITY
- There were 23,209 home sales during the second quarter of 2018. This is a drop of 2.3% compared to the same period a year ago.
- Clallam County saw sales rise the fastest relative to the same period a year ago, up 12.6%. Jefferson County also saw significant gains in sales at 11.1%.
- The number of homes for sale last quarter was down by a nominal 0.3% when compared to the second quarter of 2017, but up by 66% when compared to the first quarter of this year. Much has been mentioned regarding the growth in listings, but it was not region-wide. King County saw a massive 31.7% increase in inventory, as we do every spring and summer.
The takeaway from this data is that while some counties are seeing growth in listings — which will translate into sales down the road — the market is still out of balance and leans heavily toward the seller’s side.
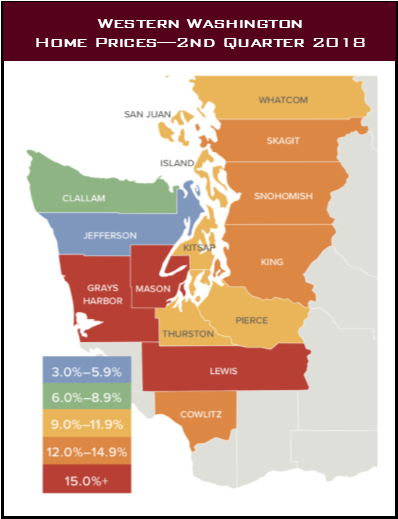
HOME PRICES
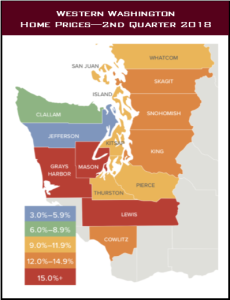
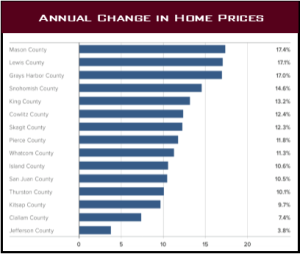 As inventory overall is still scarce, growth in home prices continues to trend well above the long-term average. Prices in Western Washington rose 12.2% over last year to $526,398.
- Home prices continue to trend higher across Western Washington, but the pace of growth has started to slow. This should please would-be buyers. The spring market came late but inventory growth in the expensive King County market will give buyers more choices and likely lead to a slowing down of price growth as bidding wars continue to taper.
- Mortgage rates, which had been rising significantly since the start of the year, have leveled off over the past month. We believe rising rates are likely the reason that inventory levels are rising, as would-be sellers believe that this could be the right time to cash out. That said, the slowing in rate increases has led buyers to believe that rates will not jump soon, which gives them a little more breathing room.
DAYS ON MARKET
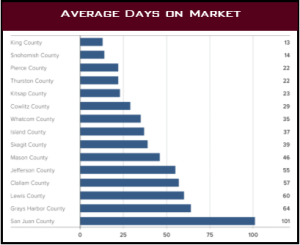 The average number of days it took to sell a home dropped by seven days compared to the same quarter of 2017.
- King County continues to be the tightest market in Western Washington, with homes taking an average of only 13 days to sell. Every county in the region other than Clallam saw the length of time it took to sell a home drop when compared to the same period a year ago.
- Across the entire region, it took an average of 41 days to sell a home in the second quarter of this year. This is down from 48 days in the second quarter of 2017 and down by 20 days when compared to the first quarter of 2018.
Although we did see some inventory increases when compared to the first quarter of the year, we are essentially at the same level of homes on the market as a year ago. The market has yet to reach equilibrium and we certainly do not expect to reach that point until sometime in 2019, if then.
Jen Hudson | (206) 293-1005 | jen@hudsoncreg.com
Duane Petzoldt | (425) 239-1780 | duane@hudsoncreg.com
MARKET INTELLIGENCE MATTERS.