2019 Windermere Everett’s Economic Update Event. By Jen Hudson

What did you miss?  Here are the highlights from March 7, 2019.

What was this “Kick Off Event” again?

Kickoff Event on March 7, 2019 at the Everett Golf & Country Club. Photo by Jen Hudson.

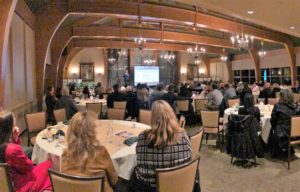
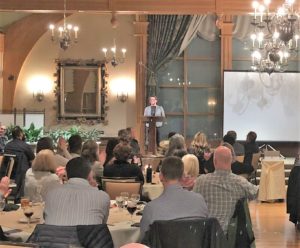
Every year, we work with our Windermere office to put together an informational and fun evening filled with quality speakers, a few appetizers, and a lot of really good people at the Everett Golf and Country Club.

Sounds good.  Who was there?

In addition to the roughly 150 valued clients and colleagues, we had a great line-up of presentations with Gary Cohn, the Superintendent for Everett Public Schools; Cassie Franklin, City of Everett Mayor; and Matthew Gardner, Windermere’s Chief Economist and one of the few economists who can brings a sense of humor to statistics.

Interesting.  Who was the opening act?

Gary Cohn kicked off the evening with a focus on kids.  He discussed some basic facts and figures to start.  Did you know that there are approximately 20,500 students in Everett public schools, with a projected growth of over 9% or another 1,858 students by 2026?  He addressed the income disparity in some of our local communities, emphasized how poverty is the single biggest factor that affects children, and noted that unfortunately almost 40% of our students are impacted.

Despite some initially startling numbers, there were many good points.  First, graduation rates.  The 4-year graduation rate from Everett schools is currently at 95.7% (oh yeah!), up from 81.7% in just 2009!  And, he talked at length about how after you adjust for poverty, Everett schools test above the trend line on everything from test scores to life preparedness.

Those numbers are surprisingly good, but where are all those extra students going to go?

The new Tambark Creek Elementary School, on track to open this year in fall 2019.  Currently, there are 17 Elementary Schools, 5 Middle Schools, and 4 High Schools.  The addition of Tambark Creek brings the district to a total of 27 schools over 39 square miles.

How do we prepare our kids to become future leaders?

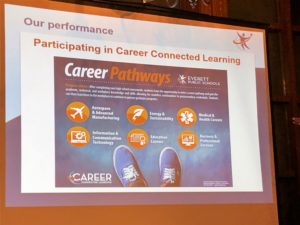
Career Pathways.  In 2013, Everett Schools became a K-12 STEM District.  Rather than limiting curriculum to the typical Science Technology Engineering and Math, they took it a step further.  After completing basic high school requirements, students have the opportunity to enter a career pathway and gain the academic, technical, and workplace knowledge and skills.  This will allow them to transfer seamlessly into their next level of schooling, pursue graduate programs, or transition to the workforce.

What about Everett? 

After 14 years, the city of Everett welcomed their new Mayor Cassie Franklin in 2018, who is also the first woman elected to the office.  This change allowed the city to rethink some of their old practices and take a fresh look at how they spend and invest resources and how to partner with more community organizations and the public for support and feedback.  Over the past 12 months, the results have spoken for themselves.  The city’s budget is not only balanced for 2019, but also achieved $5.6mil in ongoing savings through technology investments, changes to programs, and staff reductions.

What are the top issues for the city moving forward?

Quality of life.  Mayor Franklin wants to see Everett as a place that is walkable, livable, and safe.  This past year was a focus on youth gang and gun violence with prevention and intervention programs, the city’s first ever Gang Response Unit, and a firearm safety campaign which all contributed to a 40% reduction in gang-related offenses.

Another area of public focus is homelessness and addiction.  Recently, Everett has partnered with Cocoon House, HopeWorks, and the Safe Streets Housing and by 2020 will have completed 170 new supportive housing units in three new projects.  They have introduced Treatment Without Delay to help combat the opioid crisis.  And, the partnership with Bridgeways is allowing individuals to connect with new employment opportunities.  While Everett’s challenges mirror many other communities, they are ahead of the curve when it comes to seeing results and finding solutions through their unique partnership programs and approaches.

Everett’s Mayor Cassie Franklin

Economic Vitality.  Mayor Franklin has a vision that people who work in Everett also have the opportunity to live in Everett, that businesses of all sizes feel connected and supported to the City government, and that Everett is a leader in regional economic development.

Everett is, of course, proud to be home to the world’s aerospace leader, Boeing, who recently achieved a new record of 806 planes delivered in 2018.  Aerospace and Manufacturing wouldn’t happen without a close connection to the Port of Everett.  The Port has had one of their busiest years as well, with plans for the biggest capital project in the Port’s history and the largest maritime construction project on the West Coast today:  The South Terminal Modernization project.

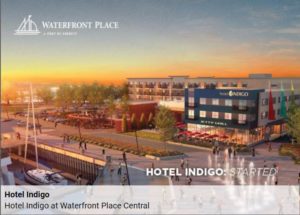
Waterfront – West Side.  Construction has begun on 266 new housing units at the Port’s Waterfront Place with a planned grand opening in 2020.  With 86% of the units already spoken for, there is a lot of excitement at the Waterfront.  Hotel Indigo is also planned to open this summer, which should double the capacity of lodging on the Waterfront.

Waterfront talk isn’t complete without mentioning Naval Station Everett.  While 2018 saw some changes, Everett has been a Navy town since 1994 and shall remain a key partner with the City moving forward.

Riverfront – East Side.  Polygon has sold nearly 320 single family homes and townhomes, with over 1,000 more in works.  The Riverfront construction is poised to take off soon for development on a new commercial center later this year that includes plans for a movie theater, grocery store, retail and restaurants.

In addition to these major projects, the Port’s Riverside Business Park is also under construction, which should bring approximately 800 new jobs to Everett that will be alongside the existing Northwest Aerospace Technologies and newer FedEx Freight facility.

Another important industry in our area is health care.  In Everett, Providence Regional Medical Center is one of our largest employers and continues to expand in the region.  Other industry leaders, such as the Everett Clinic, Kaiser Permanente and Seattle Children’s Hospital have been opening new clinics and bringing in additional jobs as well.

The vitality of Everett comes from both businesses and residents.  In the downtown sectors, we are seeing our businesses stay for longer periods of time, expand to new locations, and attract new business partners.  One of those newer additions is Funko, who have added 175 new jobs over the past 2 years.  Imagine Children’s Museum is an amazing asset to the community with major expansion plans this year as well.  The Angel of the Winds Arena saw ticket sales increase in 2018 with an incredible and diverse line-up for 2019 including the Seattle Storm, the Backstreet Boys, and more.  And, there are many new additions to our restaurant scene and downtown retailers.

Courtesy www.PortofEverett.com

Transportation and Mobility.  Economic development needs a strong transportation network.

We are fortunate to have Sound Transit, Community Transit, and Everett Transit all serving our community.  This year, the city will begin planning for 2 light rail stations for southwest Everett.  They will also begin replacement of the westbound US 2 trestle to address the current choke points with the State.  It’s estimated that by 2022, Everett will have a total of 18 electric buses on the road that will save an estimated 10,000 gallons of diesel each year.

Downtown Rucker is in the process of becoming a more pedestrian friendly corridor, along with a current parking study that may help relieve some of the challenges, as well as a pedestrian bridge connecting Everett Community College to the Washington State University (WSU) Everett campus.  2019 will see improved bus stops on Broadway, and new amenities such as shelters, benches, and bike racks.  On the other side, Grand Avenue Park Bridge will open in 2020 bringing a new connection to the waterfront.

After seeing great results from the Business Improvement Area (BIA) around the downtown corridor, there will be a new BIA around Everett Station.  There is substantial potential growth here and an understanding that the Metro area will continue to be the hub for and attract further development and future growth.

Commercial Air.  One of the biggest topics locally has been Paine Field.  Commercial air is a game-changer for Everett.  With a lodge-like design, 18 flights daily through Alaska Airlines, and additional flights from United Airlines beginning March 31, 2019, Paine Field has put Everett on a whole new map!

This year in 2019, Everett will continue to build their alliances with Snohomish County, Tulalip Tribes, and the Port, as well as all the other major sectors and businesses of all sizes in the area.

Courtesy Everett Public Schools

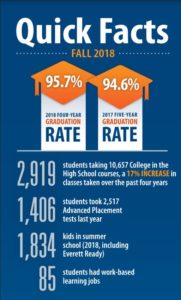
Education and Workforce Development.  In addition to the notes from Superintendent Gary Cohn, the local school districts have encouraged students to take dual-credit classes, earning both high school and college credits, and have seen an impressive increase of 876 percent more enrollments!

The Mukilteo School District includes Sno-Isle TECH, and gives students the opportunity to earn high school credits while gaining hands-on experience.  Everett Career Link is a summer internship program that provides real-world experience for high school students at businesses in their own backyard!  These programs see participation from a variety of businesses, including Providence and Kaiser Permanente as some of the most recent to enroll.

Aviation Maintenance Technician School at Everett Community College has opened for evening and afternoon classes to help meet the increasing demand for skilled technicians.  The Lab @ Everett opened last fall and has wide spread support from businesses and education communities, including power players like Amazon and Microsoft.

Wow.  That’s a lot of information on Everett.  What’s the take away?

Everett and our surrounding community will look very different in just a few years, and for many good reasons.  We have already seen advancements with increased activity, investment, and improvements to infrastructure.  Combine these advancements with nearly 300 acres of parks and green spaces to explore and a beautiful natural setting featuring both the Waterfront along the west side and the Riverfront along the east side, and you’ve got a winning combination for many years to come.

We believe you should be informed before you make decisions about your future.  After all, Everett is just one city and we didn’t even get to the economics part of the story yet.  There are still casino & mall expansions, improved roadways, new highways, and a whole new manufacturing industrial center in works, just to name a few projects in works in Snohomish County.  Stay tuned as we update you on progress.

For more information about the developments in the area or to see how your real estate is positioned with these opportunities, reach out to us at (206) 466-4020 or info@HudsonCREG.com.  You’ll be glad you did.

Jen Hudson & Duane Petzoldt

Left-to-Right: Daniel Volkert with Real Property Management, Duane Petzoldt with Windermere RE/M2, Greg Love with Windermere RE/M2, Chris Bodin with Guild Mortgage, Kevin Black with Anderson & Black Insurance

How does housing relate to the economy? We make it simple. by Jen Hudson

STATE OF THE MARKET, 1ST QUARTER 2018

We believe that the housing market is a lot more than just homes.  This graphic (below) is oversimplified, but just think about all the interlocking pieces involved for our world to function.

economy simplifiedNow with this big picture view in mind, let’s talk about what is going on in Washington State today.

The Washington State economy added 96,900 new jobs over the past 12 months, representing an annual growth rate of 2.9%—still solidly above the national rate of 1.5%. Most of the employment gains were in the private sector, which rose by 3.4%. The public sector saw a more modest increase of 1.6%.

The strongest growth was in the Education & Health Services and Retail sectors, which added 17,300 and 16,700 jobs, respectively. The Construction sector added 10,900 new positions over the past 12 months.  10,900 jobs in Construction is a start, but let’s face it… we need a lot more than that to catch up with our housing demands.

Even with this solid increase in jobs, the state unemployment rate held steady at 4.7%—a figure that has not moved since September of last year.  Remember, the unemployment rate only counts people who are looking for jobs in the workforce, not people who can’t work or who are sitting on the sidelines.

We expect the Washington State economy to continue adding jobs in 2018, but not at the same rate as last year.  Why?  A couple reasons.  One, employers only hire as many people as they need to run a company.  If employers are already fully staffed, then their business demands need to increase before making new jobs.  Plus, you can’t have new jobs without people.  If people are not able to work, or choose not to work, then you can’t hire them.  It’s that simple.  That said, we will still outperform the nation as a whole when it comes to job creation, as we have a lot of stable and “needs-based” industries here, such as Health Care, Aerospace, Education, and Transportation.

WA unemployment March 2018

Where did we lose jobs?  Manufacturing.  Our Manufacturing sector has lost 5,700 jobs this past year, with another loss of 3,300 projected.

Where else are we paying attention?  Aerospace.  There is some concern that President Trump’s steel and aluminum tariffs could hurt manufacturers such as Boeing.  While much of Boeing’s material is sourced domestically, many of their orders come from China.  If China decides to retaliate, they could easily shift their orders over to Airbus, which would hurt our local economy.  On a good note, there is a growing demand for cargo planes, which means the 767 line in Everett is expected to increase, along with 737s and 787s.

This increase in cargo planes also supports what we are seeing down in the Ports.  The container volume (you know, the giant metal containers that go from ships to trains to trucks to stores) was up 6% in February, and our breakbulk volume (meaning things that need to be loaded individually, like oil in containers or apples in crates) was up almost 30%.  The one shipment that has been down consistently?  Auto volume, which was down 8% in February.

What other major companies drive our local economy besides Boeing and the Ports?

top 10 employers
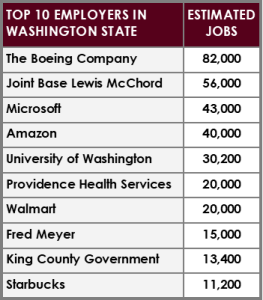
Amazon.  They currently have 8.1 million square feet of office space, which is expected to soar to 12 million square feet within the next 5 years.  Amazon’s search for H2 has concerns for slowed hiring locally, but regardless they are still one of our heavy hitters when it comes to employment.  Microsoft is also talking about expanding their Redmond Campus, which means ultimately renovating 6.7 million square feet and building another 2.5 million square feet by the end of 2020.  Other major drivers in our local economy for office space are a mix of both old and new tech companies, including Cisco, Apple, eBay, AirBNB, Uber, Snap, Alibaba, Tableau, Valve, and Wave Broadband.

On the slower side we have retailers.  We are going to lose some major stores this year both locally and nationally due to closures, including Macy’s, Sears, Kmart, Toys R Us, and Babies R Us. Despite this, there are still new retail stores and centers under construction, with others moving toward more of a mixed-use design.

Home Sales Activity: Western Washington

  • There were 14,961 home sales during the first quarter of 2018. This is a drop of 5.4% over the same period in 2017.
  • Listing inventory in the quarter was down by 17.6% when compared to the first quarter of 2017, but pending home sales rose by 2.6% over the same period, suggesting that closings in the second quarter should be fairly robust.
  • The takeaway from this data is that the lack of supply continues to put a damper on sales. We also believe that the rise in interest rates in the final quarter of 2017 likely pulled sales forward, leading to a drop in sales in the first quarter of 2018.
  • Anyone expecting to see a rapid rise in the number of homes for sale in 2018 will likely be disappointed. New construction permit activity—a leading indicator—remains well below historic levels and this will continue to put increasing pressure on the resale home market.

Annual Changes in Home Prices: Western Washington

  • With ongoing limited inventory, it’s not surprising that the growth in home prices continues to trend well above the long-term average. Year-over-year, average prices rose 14.4% to $468,312.
  • Economic vitality in the region is leading to robust housing demand that exceeds supply. Given the limited number of new construction homes, there will continue to be pressure on the resale market. As a result, we believe home prices will continue to rise at above-average rates in the coming year.
  • Mortgage rates continued to rise during first quarter, and are expected to increase modestly in the coming months. By the end of the year interest rates will likely land around 4.9% +/-, which should take some of the steam out of price growth. This is actually a good thing and should help address the challenges we face with housing affordability—especially in markets near the major job centers.

home appreciation 2

While the housing market is great today, please keep in mind that everything cycles.  Will home values drop tomorrow?  Probably not.  Keep an eye on interest rates and your timing in the market if you want to make any moves in the future.  Need help trying to predict the future?  Give us a call or email to stay ahead of the trends.

Jen Hudson (206) 293-1005 and Duane Petzoldt (425) 239-1780

The Problem with Snapshots. by Jen Hudson

If you know me, then you know that I care about the facts.  I don’t mean facts in the sense that “fake news” is overtaking our world.  That’s for a different discussion.  Just because you can find 6 friends on Facebook to agree with you, doesn’t mean you get to change the truth.

No, I mean the issue that I have anytime someone says something like “we have a shortage of housing!”.

Let’s look at some true facts and figures for our area and talk about how markets work in real life.

The Typical Graph

Here is the typical “chart” that I see floating around real estate offices or online.  I borrowed this one from Trulia.  Let’s look past the part where it is now March, and yet they are showing me data between May-August from some unknown year.

2018.03_trulia med sales price

Or sometimes we see information like this.  I stole this data from Redfin and would like to assume it’s current.

Median List Price $875k
Median Sales Price $700k
Average Sale/List Price 107.4%
Average Number of Offers 4.4
Median List Price/Square Foot $471/sf


So, these are great and everything… but what can you learn from them?

I will tell you.  Trulia’s graph makes you think prices are skyrocketing and creating a bubble, right?  Redfin makes you think everything sells with multiple offers and prices jump leaps and bounds, no matter what price you put on your home.

But, do you want to know a secret?  Pricing is really all about the market, and the market always comes back to economics 101.  Supply versus Demand.

Yes, it is really that simple.

But what numbers do you need to know to understand what is happening in the real estate market?

Let’s dig a little further in our real-life, local example, and show you what you are missing.

Let’s look at Lake Stevens to start.  What would you think if you saw the following information about Lake Stevens real estate?

Graph 1
Based on this, it appears that homes are flying off the shelf in Lake Stevens.  If I’m a seller, I expect that magically all I need to do is list my house and then about a week later, it will be sold.  As a seller, I’m also pretty sure that my house must be better than the ones that sell for $415,000, so it will of course sell faster.

Maybe.  But, maybe not.  Have you walked through what sells for $415,000 lately?  It’s different than what sold for $415,000 a couple years ago.

This is clearly not enough information.  Let’s dig further.

Now what do you think when you see the information expanded into a little more detail?

Graph 2

This is interesting too.  It appears that there is an entire range of homes selling in just 10 days.  I could sell my trailer in the woods or my waterfront estate in roughly a week and for a little more than I ask for!  Clearly everything is selling for 100.01%!

This is better, but it is still not ideal.

Now, let’s break up our information a little bit more and really dive into the activity in each price segment.

Pro-tip: Pricing Segments are keys to understanding market movement.

Graph_Lake Stevens
Alright.  Now we are talking.  This information is useful.
Side bar:  These are wide price segments shown for discussion purposes only.  In real life, I will break them down even further into ranges that would encompass your specific property and location, to get a true gauge of demand and activity.  For example, if your home is worth $450,000, then we will probably look between $400,000-$500,000, since that may be the range a typical buyer for your property looks at.

Let’s point out a couple things that may or may not be obvious.

Price Segments.  By segmenting everything into targeted price points, I can now see that there are 109 homes in Lake Stevens priced between $300-$500k and an additional 65 homes priced between $500-$750k.  I can also see that there are far fewer homes on both the lower end below $300k and the upper end above $750k, or 7 and 15 homes respectively.

I would not have known this with a general price statement, so now you can see where the competing homes for sale are.

Days on Market.  Days on market is great, but only when it is used in your targeted price segment.  Buyers want to know how quickly they will need to make and offer.  Sellers want to know how long they can expect before they need to pack up and move.

Remember that Days on Market is not a set number.  Homes will always sell for what the market is.  If it is priced lower, it could mean bidding wars and multiple offers immediately.  If a property is priced too high, it will sit for a little longer.

Graph_Lake Stevens

Activity & Demand.  This is cool too.  Do you notice how there are currently 80 buyers between $300-$500k and another 42 buyers between $500-$750k, yet there are only a handful for the lower and upper ends?  It’s something to consider, whether buying or selling.  You need to position yourself correctly and understand where you are within each price segment.

Months of Inventory.  We have all heard of buyer’s markets and seller’s markets.  But, what is that about?  First, you need to understand that all statements about months of inventory make a lot of assumptions.

They essentially say… “Assuming there are no additional listings that come on the market, no additional properties that go off the market, and a steady flow of buyers who will consistently continue to buy homes at the same rate they have over the past 6 months (or 12 months or whatever number you are using for data), then it will take XX number of months to sell the rest of the available homes.”

Is that a real life scenario?  No.

I do think the months of inventory is a good gauge to look at and keep in mind when trying to price your property strategically, but it is also important to recognize there are other things at play beyond our control.  Things like the season, weather, interest rates, local economy, community development (or lack of), employers, global economic forces, and more.

Graph_Lake Stevens

Demand Ratio.  The demand ratio is something I made up, but it gives us a very realistic perspective of where the buyers are, and in a very common sense way.  Let’s define the demand ratio as number of pending homes divided by number of homes listed on the market (active plus pending).

For example, if there are 80 buyers under contract (pending) and 109 sellers wanting to sell (80 pending plus 29 active), they have a demand ratio of 0.7 (80 divided by 109).  This is a good strong number if I’m a seller and means there is a lot of competition if I’m a buyer.  What we have just figured out is that for every home on the market, there are 0.7 buyers looking for it.

However, if there is only 1 buyer under contract above $1 million, and 5 homes left to choose from over (means 1 pending plus 5 active = 6), then my demand ratio has dropped significantly to 0.17.  Now, the ball is in the buyer’s court with a plenty of options to consider and low competition from other buyers.

Some obvious things to point out:

  1. If we are talking about a demand ratio and there are no buyers in that price range and area… then the demand is zero (0).  If you are a buyer, this is a wonderful time to shop since you are your only competition.  If you are a seller, then you had better get realistic about your price to try and attract all potential buyers.  Period.
  2. If all the homes on the market are under contract or pending, then your demand ratio is one (1).  In that case, if you are a buyer then you will need to be ready to pounce immediately on the next opportunity that comes along.

If you are a seller, you still can’t be greedy.  While it is tempting to want to test the waters a little, remember than an overpriced property is still overpriced.

Sales Price versus List Price Ratios.

You may have noticed that I did not include any information about what the ratio for sales price versus list price.

Here’s my two cents and opinion on the topic.

I think agents need to know what their sales price versus list price ratio is, but I think this number is misinterpreted.  With the correct exposure and negotiating for any property, a professional agent will be able to get you the best of what the market will bear.

I am sure you have talked with someone or seen statistics where a home received 15 offers and sold for 112% of it’s list price.  Many people use it almost like bragging rights today… but this isn’t something they would brag about if they understood what happened.

Multiple offers and a bidding war might be great in most seller’s minds, but do you know what I think?  I think that whoever the agent was didn’t understand their market at all and was a disservice to their client instead.

Consider the numbers.  If you are the seller in Lake Stevens with a $415,000 home… that means your agent almost lost you 12% or $49,800 in your sale.  Something to think about anyway.

For me personally, as a Seller’s agent my list to sales price ratio is 101.7% based on the last year.  This indicates I am a little more aggressive for pricing and pulled in a couple buyers to use against each other to bid the property up.  In this market this competitive strategy works, but it depends on your price segment and demand ratios.

As a Buyer’s agent, my list to sales price ratio is 95.5%, indicating I find deals for my clients and know how to negotiate them down to favorable terms.

The Big Secret About Obvious Information

Here is one last thing to keep in mind.  In many circumstances like we have today, this is the optimal time to “move-up” into your next almost dream house.  Depending on your location and the market conditions, you could easily be in a “seller’s market” as you sell your $450k home and quickly shift into your next move into a slower moving balanced or buyer’s market, as you purchase your new $700k home.  The different segments within the market, plus the equity you may have earned in your current home could start to pay off much more quickly than you realize and ultimately get your closer to your dreams.

The next time you see a generic graph or table with basic information, take a moment to consider what is really going on in the market.  Of course, if you need help and want real answers from a true professional, then I’m easy to find most any day except Sundays.

I hope this helps you with your plans toward the big picture.  My partner Duane and I would be honored to help you with your next move or investment… since it is an amazing time to take advantage of what other people don’t know or just can’t see.  You can call Jen at (206) 293-1005 or Duane at (425) 239-1780.

Cheers!

Jen Hudson & Duane Petzoldt