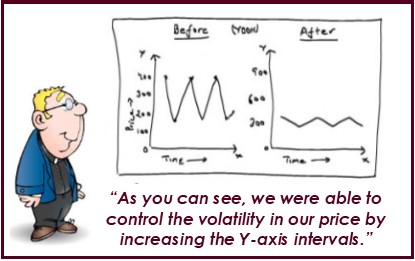
If you know me, then you know that I care about the facts. I don’t mean facts in the sense that “fake news” is overtaking our world. That’s for a different discussion. Just because you can find 6 friends on Facebook to agree with you, doesn’t mean you get to change the truth.
No, I mean the issue that I have anytime someone says something like “we have a shortage of housing!”.
Let’s look at some true facts and figures for our area and talk about how markets work in real life.
The Typical Graph
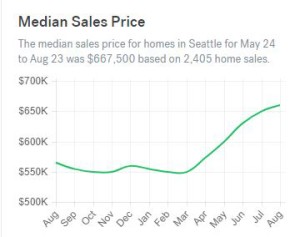
Here is the typical “chart” that I see floating around real estate offices or online. I borrowed this one from Trulia. Let’s look past the part where it is now March, and yet they are showing me data between May-August from some unknown year.
Or sometimes we see information like this. I stole this data from Redfin and would like to assume it’s current.
| Median List Price | $875k |
| Median Sales Price | $700k |
| Average Sale/List Price | 107.4% |
| Average Number of Offers | 4.4 |
| Median List Price/Square Foot | $471/sf |
So, these are great and everything… but what can you learn from them?
I will tell you. Trulia’s graph makes you think prices are skyrocketing and creating a bubble, right? Redfin makes you think everything sells with multiple offers and prices jump leaps and bounds, no matter what price you put on your home.
But, do you want to know a secret? Pricing is really all about the market, and the market always comes back to economics 101. Supply versus Demand.
Yes, it is really that simple.
But what numbers do you need to know to understand what is happening in the real estate market?
Let’s dig a little further in our real-life, local example, and show you what you are missing.
Let’s look at Lake Stevens to start. What would you think if you saw the following information about Lake Stevens real estate?
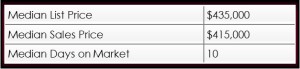
Based on this, it appears that homes are flying off the shelf in Lake Stevens. If I’m a seller, I expect that magically all I need to do is list my house and then about a week later, it will be sold. As a seller, I’m also pretty sure that my house must be better than the ones that sell for $415,000, so it will of course sell faster.
Maybe. But, maybe not. Have you walked through what sells for $415,000 lately? It’s different than what sold for $415,000 a couple years ago.
This is clearly not enough information. Let’s dig further.
Now what do you think when you see the information expanded into a little more detail?
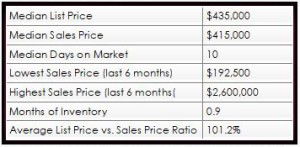
This is interesting too. It appears that there is an entire range of homes selling in just 10 days. I could sell my trailer in the woods or my waterfront estate in roughly a week and for a little more than I ask for! Clearly everything is selling for 100.01%!
This is better, but it is still not ideal.
Now, let’s break up our information a little bit more and really dive into the activity in each price segment.
Pro-tip: Pricing Segments are keys to understanding market movement.
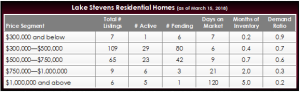
Alright. Now we are talking. This information is useful.Side bar: These are wide price segments shown for discussion purposes only. In real life, I will break them down even further into ranges that would encompass your specific property and location, to get a true gauge of demand and activity. For example, if your home is worth $450,000, then we will probably look between $400,000-$500,000, since that may be the range a typical buyer for your property looks at.
Let’s point out a couple things that may or may not be obvious.
Price Segments. By segmenting everything into targeted price points, I can now see that there are 109 homes in Lake Stevens priced between $300-$500k and an additional 65 homes priced between $500-$750k. I can also see that there are far fewer homes on both the lower end below $300k and the upper end above $750k, or 7 and 15 homes respectively.
I would not have known this with a general price statement, so now you can see where the competing homes for sale are.
Days on Market. Days on market is great, but only when it is used in your targeted price segment. Buyers want to know how quickly they will need to make and offer. Sellers want to know how long they can expect before they need to pack up and move.
Remember that Days on Market is not a set number. Homes will always sell for what the market is. If it is priced lower, it could mean bidding wars and multiple offers immediately. If a property is priced too high, it will sit for a little longer.
Activity & Demand. This is cool too. Do you notice how there are currently 80 buyers between $300-$500k and another 42 buyers between $500-$750k, yet there are only a handful for the lower and upper ends? It’s something to consider, whether buying or selling. You need to position yourself correctly and understand where you are within each price segment.
Months of Inventory. We have all heard of buyer’s markets and seller’s markets. But, what is that about? First, you need to understand that all statements about months of inventory make a lot of assumptions.
They essentially say… “Assuming there are no additional listings that come on the market, no additional properties that go off the market, and a steady flow of buyers who will consistently continue to buy homes at the same rate they have over the past 6 months (or 12 months or whatever number you are using for data), then it will take XX number of months to sell the rest of the available homes.”
Is that a real life scenario? No.
I do think the months of inventory is a good gauge to look at and keep in mind when trying to price your property strategically, but it is also important to recognize there are other things at play beyond our control. Things like the season, weather, interest rates, local economy, community development (or lack of), employers, global economic forces, and more.
Demand Ratio. The demand ratio is something I made up, but it gives us a very realistic perspective of where the buyers are, and in a very common sense way. Let’s define the demand ratio as number of pending homes divided by number of homes listed on the market (active plus pending).
For example, if there are 80 buyers under contract (pending) and 109 sellers wanting to sell (80 pending plus 29 active), they have a demand ratio of 0.7 (80 divided by 109). This is a good strong number if I’m a seller and means there is a lot of competition if I’m a buyer. What we have just figured out is that for every home on the market, there are 0.7 buyers looking for it.
However, if there is only 1 buyer under contract above $1 million, and 5 homes left to choose from over (means 1 pending plus 5 active = 6), then my demand ratio has dropped significantly to 0.17. Now, the ball is in the buyer’s court with a plenty of options to consider and low competition from other buyers.
Some obvious things to point out:
- If we are talking about a demand ratio and there are no buyers in that price range and area… then the demand is zero (0). If you are a buyer, this is a wonderful time to shop since you are your only competition. If you are a seller, then you had better get realistic about your price to try and attract all potential buyers. Period.
- If all the homes on the market are under contract or pending, then your demand ratio is one (1). In that case, if you are a buyer then you will need to be ready to pounce immediately on the next opportunity that comes along.
If you are a seller, you still can’t be greedy. While it is tempting to want to test the waters a little, remember than an overpriced property is still overpriced.
Sales Price versus List Price Ratios.
You may have noticed that I did not include any information about what the ratio for sales price versus list price.
Here’s my two cents and opinion on the topic.
I think agents need to know what their sales price versus list price ratio is, but I think this number is misinterpreted. With the correct exposure and negotiating for any property, a professional agent will be able to get you the best of what the market will bear.
I am sure you have talked with someone or seen statistics where a home received 15 offers and sold for 112% of it’s list price. Many people use it almost like bragging rights today… but this isn’t something they would brag about if they understood what happened.
Multiple offers and a bidding war might be great in most seller’s minds, but do you know what I think? I think that whoever the agent was didn’t understand their market at all and was a disservice to their client instead.
Consider the numbers. If you are the seller in Lake Stevens with a $415,000 home… that means your agent almost lost you 12% or $49,800 in your sale. Something to think about anyway.
For me personally, as a Seller’s agent my list to sales price ratio is 101.7% based on the last year. This indicates I am a little more aggressive for pricing and pulled in a couple buyers to use against each other to bid the property up. In this market this competitive strategy works, but it depends on your price segment and demand ratios.
As a Buyer’s agent, my list to sales price ratio is 95.5%, indicating I find deals for my clients and know how to negotiate them down to favorable terms.
The Big Secret About Obvious Information
Here is one last thing to keep in mind. In many circumstances like we have today, this is the optimal time to “move-up” into your next almost dream house. Depending on your location and the market conditions, you could easily be in a “seller’s market” as you sell your $450k home and quickly shift into your next move into a slower moving balanced or buyer’s market, as you purchase your new $700k home. The different segments within the market, plus the equity you may have earned in your current home could start to pay off much more quickly than you realize and ultimately get your closer to your dreams.
The next time you see a generic graph or table with basic information, take a moment to consider what is really going on in the market. Of course, if you need help and want real answers from a true professional, then I’m easy to find most any day except Sundays.
I hope this helps you with your plans toward the big picture. My partner Duane and I would be honored to help you with your next move or investment… since it is an amazing time to take advantage of what other people don’t know or just can’t see. You can call Jen at (206) 293-1005 or Duane at (425) 239-1780.
Cheers!
Jen Hudson & Duane Petzoldt