A GOLDILOCKS ECONOMY. By Jen Hudson
You know Goldilocks, right? Not too hot. Not too cold. But, just right? Well, that’s kind of what our economic reports are looking like right now.
LET’S TALK JOBS.
The Initial Jobless Claims is a report issued by the U.S. Department of Labor on a weekly basis. It’s important on a macro level, as it measures the number of claims filed by individuals seeking state jobless benefits.
Well… Initial Jobless Claims continue to impress! For the last week of November 2015, the figure has dropped to 260,000… which is near a 42 year low. This obviously points to a healthier labor market.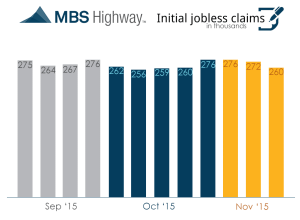
FED SPEAK.
The “core” Personal Consumption Expenditures price index, or PCE, is a measure of prices for what consumers pay for goods and services. This measure excludes food and energy prices.
I think the idea for the measure of PCE initially was something like “if eggs get too expensive, people will buy something else to replace it.” With that, they exclude things like food and energy, since you can find replacements for everyday items relatively quickly.
Regardless of whether or not I think this makes sense, PCE is the Fed’s favorite gauge to measure inflation. With that, PCE is currently at 1.3% on a year over year basis. As we acknowledge above, this is probably a little light since it strips out food and energy costs, but knowing this, it’s a good solid number.
PRICES WE PAY.
The Consumer Price Index, or CPI, measures the change in prices that a consumer will pay for goods and services. It is reported monthly from the Bureau of Labor Statistics. There is a heavier focus on housing expenses and health care expenses in this number than in PCE. Usually retail or office leases will base their annual escalation clauses off of CPI.
CPI is holding its own at 1.9% on a year over year basis. Once again, .. it seems like it is “just right” for the Goldilocks story.
HOUSING PRICES.
The Federal Housing Finance Agency, or FHFA House Price Index is one of many measures for prices on single family homes. It is a “repeat-sales” index, so it measures price changes on repeat sales or refinances for the same property. In theory, it doesn’t get skewed as much with new construction. I think they measure this quarterly.
On a year over year basis, the FHFA House Price Index shows home prices increased to 5.7% on a year over year basis.
NEW HOME SALES.
Finally, we have New Home Sales in October. New Residential Home Sales are tracked by the U.S. Census Bureau and the Department of Housing and Urban Development each month.
Sales of New Homes are up 4.9% year over year, to a seasonally adjusted rate of 495,000. The median sales price was $281,500, and the average was $366,000. Overall, a strong (but, you know… not too strong, and not too soft) report.
Market Intelligence Matters.
Jen Hudson
(206) 293-1005
Jen@HudsonCREG.com