In case you missed it, Washington State had an emergency for the last two years… and it was over who got to make decisions about water.
What am I talking about?
Let’s go back to the beginning.
At first glance, water rights or water claims don’t seem like they should be that complicated. It’s just water. We have lots of water.
But, then you start to think about it for a moment… and immediately confusion sets in.
I’ll try to simplify.
In Washington State, we have the Department of Ecology. Call them the DOE, since it looks cool. The DOE are the “big dogs” when it comes to all things water.
While I can’t explain how they reach their conclusions, the DOE looks at where water flows, how much we have, what it is used for, and so on.
Now… my overly simplified version of water rights or water claims.
The Department of Ecology says that water rights belong to the state and that an individual or group can be granted “rights” to use a certain amount of water, for a specific purpose, and in a specific place.
They care a lot about both fish and people. So, what does the DOE look at?
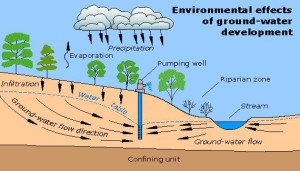
Imagine that it rains in your front yard. The DOE might be able to tell you not only where those rain drops go after they soak into the ground, but also how long it takes those drops to get there. Does it take 1 month for the drops to make it to the pond, and then a year to make it to a stream, and then 20 years to make it to the ocean? Maybe.
Does the DOE put little individual trackers on rain drops to see exactly where they scatter too? Probably not.
However, the DOE is likely the most reliable source for predicting exactly where water goes over time than anyone else in the State. So, they get a lot of points for that.
If you wanted to build a house, or a shopping center, or a ranch, or even a farm, it is likely that the DOE is involved. After all, they get to determine if there is enough water to feed your family or your herd of cattle or even to water your tomatoes.
Who actually uses water from the ground?
I hope you paused just for a moment with that question. Everyone does. Let’s not get off topic. Not everyone know how water gets to your faucet.
How are water rights decided?
There are over 230,000 active water right certificates, permits, applications, and claims that the DOE manages to make sure the state can meet all the water supply needs.
With so many people needing water, and no actual guarantee there will be enough, the DOE uses a system called “the doctrine of prior appropriation.” This is fancy talk for “first in time, first in right.” Essentially, if there is a water shortage, then the senior water rights get their water first and the junior (meaning younger) rights can be slowed or taken away.
What does it take to issue a water right permit?
They have a four-part test, to make it simple.
- Water must be both physically and legally available. Not only does there need to be actual water there, but there needs to be enough water after everyone else ahead of you in line has a drink from the faucet.
- Water must be used beneficially… no wasting please.
- Water use must be in the public’s interest. For example, in the Gremlins movie, spilling water on Gizmo is a bad idea because it spawns Gremlins which are evil little monsters who are not in the public’s best interest. You probably don’t get a water right permit for Gremlins.
- Water use must not impair another existing use. No stealing. Pretty simple.
Wait. There’s a catch. The continuous use rule.
Even if you are the oldest water right at the very beginning of the line, if you stop using your water for 5 consecutive years, then you lose your spot in line and the state takes their rights back.
How does the state know whether or not you are using water?
That part is easier than you think.
In many parts of Eastern Washington, think of things like satellite images or even google streets. If your property is the only brown one surrounded by a sea of green, then odds are you aren’t watering your plants. The same is true in the reverse. If you are the only green field among a bunch of brown ones, then you are probably using water when you shouldn’t. Neighbors and local departments tend to watch these things.
Now for the Definitions.
There are a few terms you hear around water rights. A water right permit is just that. It is a permit to develop a water right.
- Permit – A Water Right Permit is an authorization to use a specific amount of water in a specific place, during a certain season, and with a specific purpose. Whew!
- Certificate – A Water Certificate documents a “perfected” water right put to it’s full use and recorded in appropriate county on the deed for that property.
- Adjudicated Certificate – A Certificate that has not only been in use and recorded, but also validated by a local superior court… which means someone questioned it earlier. Adjudication is a special court process that determines if something is legally valid. So, adjudicated certificates are pretty solid.
- Claim – A water claim is an old water right that so old it came before the current water permitting system (prior to 1917 for surface water and prior to 1945 for ground water). If anyone questions these claims, then the only way they can be confirmed is through adjudication.
- Trust Water Right – This is the safety button so you don’t lose your place in line. If you know that you will not use your water rights for a while, but you don’t want them to be taken away, you can place your water right into the Trust Water Rights Program to protect it from relinquishment due to non-use.
While all these names are all different, they provide similar benefits… such as access to water.
This leads us to the simple question.
Do you need a water right? I’m glad you asked.
As with most things real estate… it depends.
It is important to realize there is a difference in the rules between water that is above ground and water that is below.
Surface water is the water above ground. Think water from streams, rivers, lakes, springs. If you ever want to use surface water in any way at all… you will need a water right to do so.
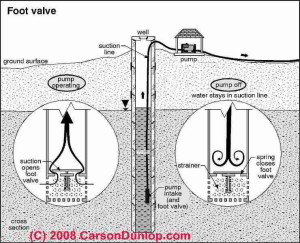
Ground water is a little different. Think drilling wells, tapping into aquafers, joining a community water system, or even a public utility district. If we are talking about using ground water, there are some exemptions that let you just use the water when you needed it from below the surface.
Side bar: We were told for many years that surface water and ground water are different… but if all the water from the surface (rainfall to steams to rivers, etc) eventually runs below the ground to the aquifers… then why are there different rules? I don’t have the answer. Just a lot of questions.
Those exemptions are:
- A single user or group of domestic uses that use less than 5,000 gallons per day;
- Industrial uses of less than 5,000 gallons per day;
- Irrigation and non-commercial uses of less than one-half acre of lawn or garden; or
- Stock water… for things like cows.
As a point of reference, most households use around 200 gallons per day. Some mature trees use more than that. Some use far less.
Previously, we had a system for who got to use water. Let’s just sum up the issue of who decides whether you can use water varies depending on the location you are in. The DOE had rules relating to seniority of water rights, watershed plans, growth areas, etc. The goal is protect water quality, availability, and all things that surround it.
If you were joining a community system or municipality, you would get a water availability letter showing they had enough water to share with you. If you needed to drill your own well and were not exempt from above, then it got a little trickier.
In theory, if you had an old water right and wanted to move it to a new location… as long as you were pulling water from the same source, it was ok to transfer.
What happened in 2016?
Whatcom County got in a fight with Eric Hirst over water. In the initial court case, the decision ended up turning everything we used to know about water on its head. This single decision (turning that time from 2016-2018) had completely changed how counties approved or denied building permits for homes that we thought were permit-exempt wells for a water source.
So what happened next?
Essentially, the local counties had to become experts in all things water… overnight and without warning. No offense to most counties and cities out there, but they never had to be the water expert before… so how do you think it went when they now had to make decisions?
It went how you would imagine.
Some cities and counties said “no more building permits for you”. Some of them said “we will give you this building permit, but you can’t have any water.” Some of them said “you can build whatever you want, but you don’t get your building permit until you promise not to sue us if we’re wrong.” To be blunt, it was a mess. There was no clarity. Land values where water was questionable sunk overnight. Land values where water was clearly available went up and saw bidding wars. In certain areas, people began purchasing land just for the water rights.
It was a continuous legal fight since 2016 and finally this ruling was overturned through a new law. Engrossed Substitute Senate Bill 6091 was passed on January 18, 2018 and was immediately signed into law the next day by WA Governor, Jay Inslee. This new law helps protect water resources while providing water for families in rural Washington.
What does this new law do? It’s not perfect, but it’s a really good start.
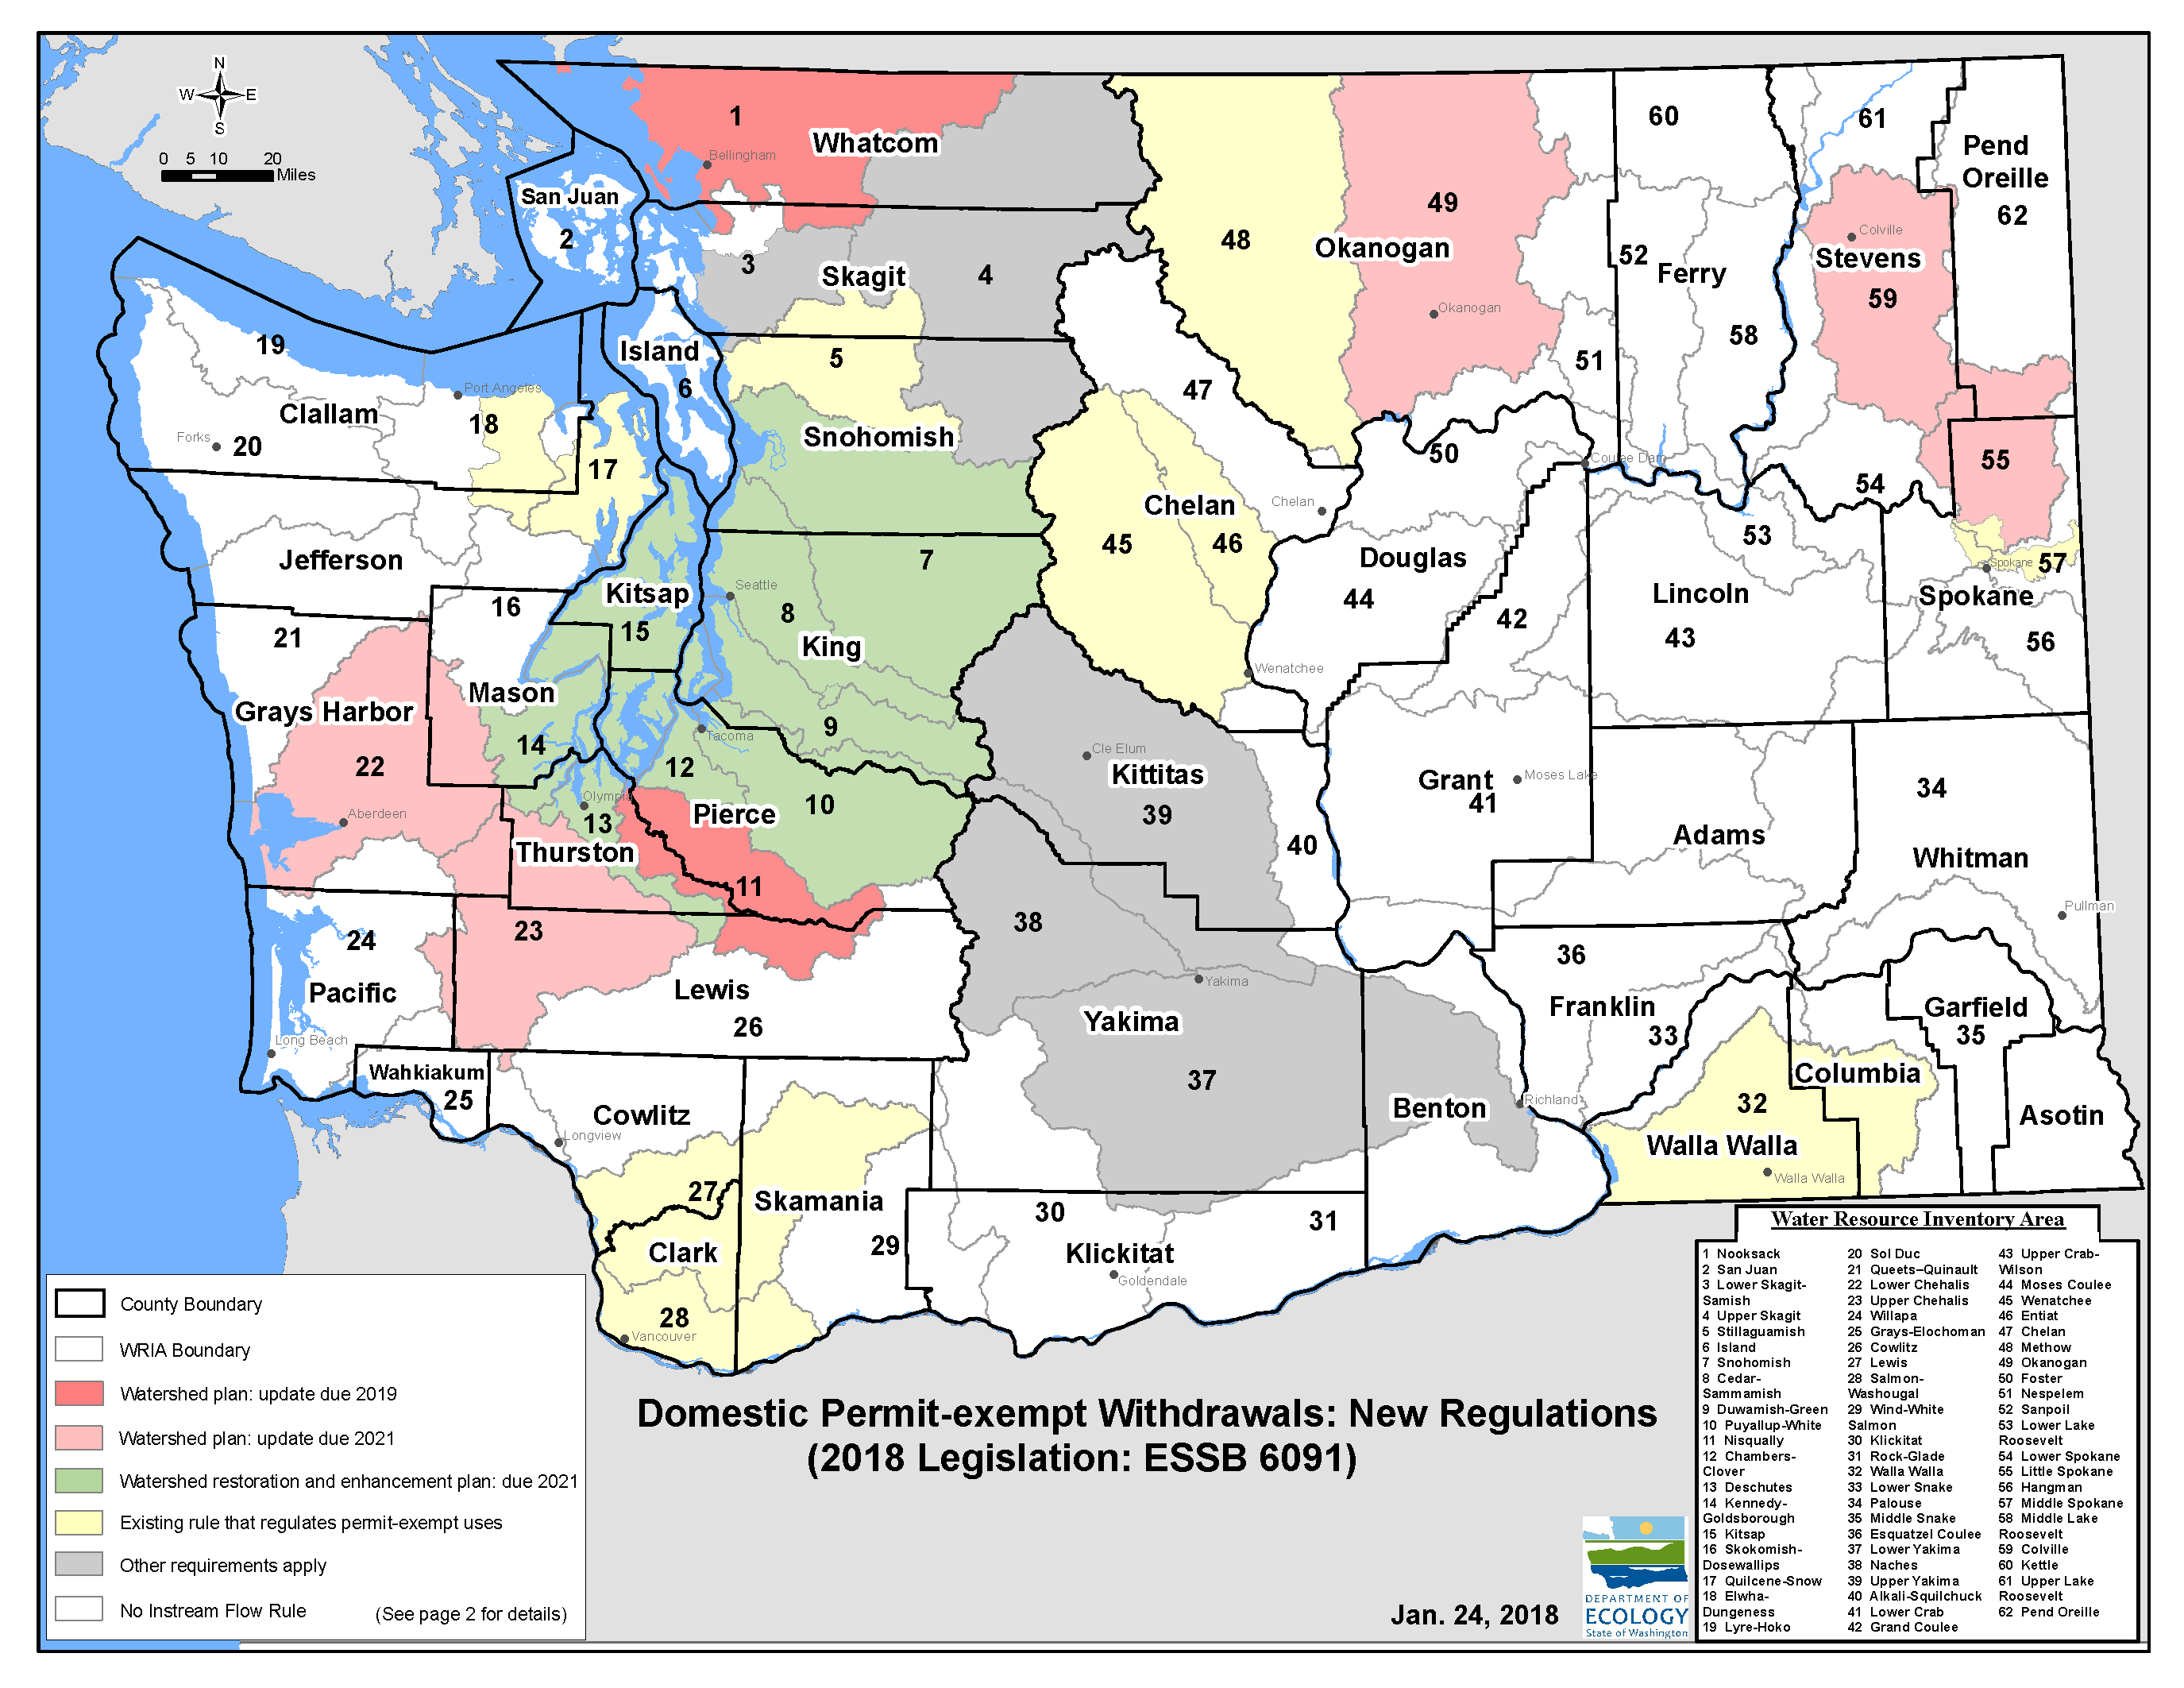
- The law focuses on 15 watersheds that were impacted most by the Hirst decision and establishes standards for residential permit-exempt wells. Now, the cities and counties can go back to some of the old rules and no longer be burdened with having to be an expert in an area they aren’t familiar with.
- The law divides the 15 basins into those that have previously adopted a watershed plan and those that did not. This adds clarity for how decisions are made.
- The law allows counties to rely on our instream flow rules in preparing comprehensive plans and development for water availability. That’s great, because the local jurisdictions just didn’t have the hours in to become the water experts on their own.
- It allows rural residents to have access to water from permit-exempt wells to build a home. All those people in the country just got to live in their homes again or finish building, which is great.
- Retains the current maximum limit of 5,000 gallons per day for permit-exempt domestic water use in watersheds that do not have existing instream flow rules.
- It lays out interim standards that will apply until local committees develop plans that are adopted:
- Allows a maximum of 950 or up to 3,000 gallons per day for domestic use, depending on the watershed they are in.
- Establishes a one-time $500 fee for landowners building a home using a permit-exempt well in certain affected areas.
- Invests $300 million over 15 years in projects that will help fish and stream flows (aka new jobs).
(Learn More: https://ecology.wa.gov/Water-Shorelines/Water-Supply/Water-Rights/Case-Law/Hirst-Decision)
So, after all this… will the local counties or cities change their tune and start issuing building permits again? Eventually, I think they will. Since this is brand new law, it will take a little time for the counties to evaluate how it impacts their decisions and development codes. However, with such an important topic, I believe that most counties are trying to respond as quickly as they can and issue building permits accordingly.
What impact does this have on old wells?
Not much. The law went into effect on January 19, 2018. All wells that were constructed prior to this date were subject to old rules which meant they had to show evidence of adequate water supply. All wells after this date are subject to the new law and new exemptions.
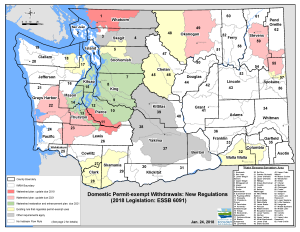
Which watersheds had previously adopted plans and is now subject to the 3,000 gallons per day with drawl? The Nooksack, Nisqually, Lower Chehalis, Upper Chehalis, Okanogan, Little Spokane, and Colville.
Which watersheds do not have a previously adopted plan and are now subject to a maximum withdrawal of 950 gallons per day? The Snohomish, Cedar-Sammamish, Duwamish-Green, Puyallup-White, Chambers-Clover, Deschutes, Kennedy-Goldsborogh, and Kitsap. These eight watersheds are also subject to curtailment during droughts reducing their use to 350 galloons per day for indoor use only.
Why all this talk about water?
First. We all need water and we probably take it for granted. Did you know that in just 2 years, Washington State has dropped from the 3rd best drinking water in the country to the 39th on the list! (source: Washington State Economic Climate Study 2017) If you have not seen the news, the South African city of Cape Town is likely to be the first major city in the world to run out of water. In my opinion, running out of physical water and running out of clean water… kind of the same thing.
Second. We all know someone who has land in a more rural area. There are a number of properties throughout Washington in some of our more rural locations who saw land values sink almost overnight if they didn’t have legally available water in use. That may have just changed. Give me a call to find out what it means.
Want to talk about your land value or how this may impact you?
(206) 293-1005 or jen@hudsoncreg.com any day except Sunday
Market Intelligence Matters.


 That. Is. Scary. Especially when most emergencies cost a lot more than $1000… at least from what I have seen.
 Now with this big picture view in mind, let’s talk about what is going on in Washington State today.
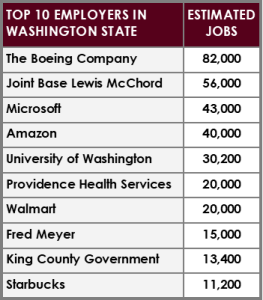 Amazon. They currently have 8.1 million square feet of office space, which is expected to soar to 12 million square feet within the next 5 years. Amazon’s search for H2 has concerns for slowed hiring locally, but regardless they are still one of our heavy hitters when it comes to employment. Microsoft is also talking about expanding their Redmond Campus, which means ultimately renovating 6.7 million square feet and building another 2.5 million square feet by the end of 2020. Other major drivers in our local economy for office space are a mix of both old and new tech companies, including Cisco, Apple, eBay, AirBNB, Uber, Snap, Alibaba, Tableau, Valve, and Wave Broadband.


 I have never claimed to have a crystal ball, but this is the first time in the last 13 years where I feel the need to send out an update right away.
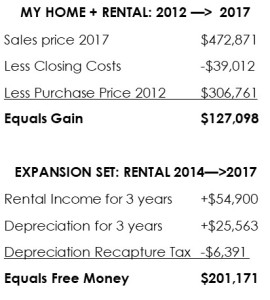
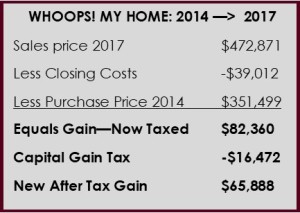
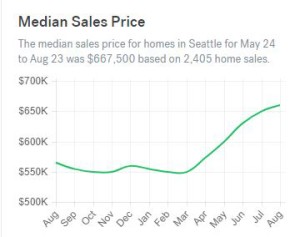
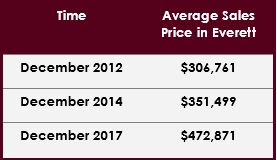 In December 2012 in Everett, the average sales price for a home was $306,761. In December 2014, it was $351,499. In December 2017, it was $472,871… geez! That’s a lot of money in Everett.